DataTrek: Oil Prices Hitting $140 Would Mean Recession In The Next 12-18 Months
By Nicholas Colas of DataTrek Research
1970s Debt Vs. Today
Two “Markets” items today:
Topic #1: Let’s talk about US Federal government and business debt levels. Such conversations are usually laden with fire and brimstone narratives, but we will avoid those as much as we can. Let’s just focus on the facts and see where they lead us.
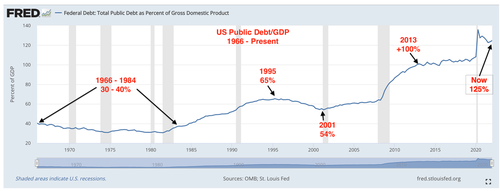
First, here is total Federal public debt as a percent of GDP. This does not include intragovernmental holdings ($6.5 trillion currently, mostly held by entitlement programs), but it does capture the general trends quite well.
Three points about this graph:
US government debt as a percent of GDP has risen dramatically over the last +50 years, from lows around 30 percent in 1980 to 125 percent today.
The pattern of this growth is both structural and cyclical. Debt/GDP was at its lowest during this time series in 1980, when Treasury yields were at their highest. As yields fell, borrowing increased. But … Debt/GDP actually declined in the mid-late 1990s as strong labor and stock markets increased tax receipts. The Great Recession, which brought lower tax receipts and stimulative fiscal spending, increased debt issuance once again. The Pandemic Crisis had the same effect.
The US now has a higher Debt/GDP ratio than the Eurozone (95 pct) and the United Kingdom (88 pct), as well as China (78 pct) and India (87 pct).
Now, let’s look at US non-financial business debt (both bonds and loans) as a percent of GDP:
Two points about this data:
Corporate debt/GDP is 40 percent higher now than in the inflationary/high interest rate 1970s. The offsetting positive is that public and larger private companies have much higher equity valuations now versus the 1970s. Issuing stock to pay down debt may not be any CEO or shareholder’s favorite idea, but it can be done if debt service costs become too burdensome.
Current corporate debt/GDP levels in the high 40-percent range are still higher than the 2 prior peaks (2001 and 2008) of 45 percent.
Takeaway (1): debt is now a much larger part of the US economy than in the 1970s, and any discussion of inflation-fighting monetary policy must acknowledge that difference. Neither the US government nor private business can afford +10 percent Treasury/corporate debt yields. Those were commonplace in the 1970s; they would be very damaging now. This is why we say the famous “Fed Put” has shifted from stocks to the Treasury market. Chair Powell and the FOMC know that they must keep structural inflation at bay and Treasury yields low. Much, much lower than the 1970s …
Takeaway (2): we think this is one reason US equity markets get into trouble when Treasury yields hit 3 percent. That was the case in Q4 2018, and the same is true now. It’s not that a 3 percent cost of risk-free capital is inherently unmanageable, either for the Federal government or the private sector. Rather, it is the market’s way of signaling the manifold uncertainties if rates don’t stop at 3 percent, but instead keep rising.
Topic #2: The latest reading of the New York Fed’s Global Supply Chain Pressure Index was out this morning. This metric covers US, European and Asian purchasing manager surveys as well as real-time shipping cost analysis. The output is based on standard deviations from pre-pandemic “normal”, which for this index’s purposes is zero.
The following chart shows the index’s readings from late 2014 to the present. As noted, the first peak was in the early stages of the global pandemic crisis (April 2020, 3.4 standard deviations from pre-pandemic levels). The second was in late 2021, at 4.3 – 4.4 standard deviations.
May 2022’s reading of 2.9 standard deviations is down from April’s 3.4 level but still above February and March’s 2.8 level. The Fed’s own commentary noted “The moves in the GSPCI over the past three months suggest, for now, a stabilization of global supply chain pressures.”
Takeaway: global supply chain snarls continue to exert inflationary pressure on the US and global economy. At the margin, however, they are easing slightly. We’ve gone from +4 standard deviations of “pressure” down to just less than 3 standard deviations in the last 6 months. On Friday we will get the latest US CPI inflation report, and that will tell us if this is enough to reduce overall inflation.
As an aside: in other inflation-related news, WTI crude broke $120/barrel today.
We still believe $140/barrel is the level to watch as a recession indicator.
That would be a double from last summer’s $70/barrel level, and any time since 1970 when oil prices have gone up 2x in a year a recession has followed in the next 12-18 months.
Going back to 1970s (using @Bloomberg historical crude price index), quite rare to see oil prices spike at this fast of an annual rate (orange) and not have a recession associated with it (late 1980s and early/mid-2000s were exceptions) pic.twitter.com/As2mnWEVH3
— Liz Ann Sonders (@LizAnnSonders) June 9, 2022
The July 4th weekend typically marks the start of peak gasoline demand in the US; oil most likely tops out around this period in the near term. Let’s hope it does so with a $130-handle rather than anything higher.
Tyler Durden
Thu, 06/09/2022 – 11:45

