These Are The Best (And Worst) American Cities For Economic Mobility
Behold – the American dream.
Where a fair and equal society allows anyone the ability to fashion the life they want, providing they’re willing to work for it.
A cornerstone of that dream is that each generation does better than the last, building and benefiting from growing economic opportunities.
But this does not necessarily hold true for all Americans.
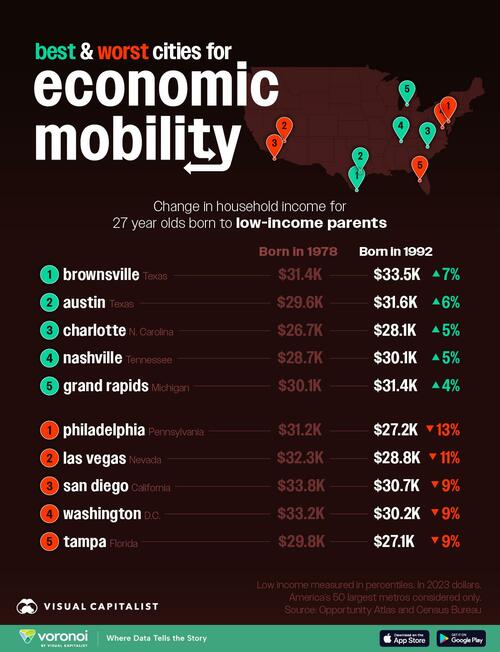
This chart, via Visual Capitalist’s Pallavi Rao, compares the real household income of 27-year-olds from two generations: those born in 1978 and those born in 1992, both raised by low-income parents. All figures are in 2023 dollars.
ℹ️ 27 is the earliest age at which estimates of adult incomes can be measured. Only the 50 largest metros were considered in this analysis. Low-income is categorized by percentile groups.
A positive percentage change implies economic mobility, allowing us to see the cities where adults had a chance to better their circumstances, and to what extent.
Data is sourced from a study conducted by Opportunity Atlas in partnership with the Census Bureau.
Where is the American Dream Still Alive?
Southern cities in Texas, Tennessee, and North Carolina did see upward mobility between generations in the lowest income group, with real wages improving 5-7%.
For example, in Brownsville, Texas, those born to low-income parents in 1992 earned an average of $33,000 at age 27. This is around $2,000 more than their 1978-born peers at the same age, the highest increase across all 50 metro areas.
In contrast, Philadelphia, Pennsylvania, saw real incomes decline across generations. The 1978 cohort earned a similar salary to their peers in Brownsville ($31,200), but a generation later, incomes dropped to $27,200.
In fact, only 12 of the 50 saw real income growth across generations for this economic class. And five of them were in Texas. This means that in 38 cities real wages fell between generations.
Zooming out, the average household income at 27 across the nation (for those born to low-income parents) dropped by 4%.
This class difference is important. Because when looking at the highest income percentile, the average income between generations increased 5%.
Wondering where wages adjusted for the cost of living are the highest in the country? Check out Mapped: Median Income by State for a quick overview.
Tyler Durden
Thu, 12/05/2024 – 18:00


