Why Consumers Are Angry About The Economy In Five Pictures
Authored by Miked Shedlock via MishTalk.com,
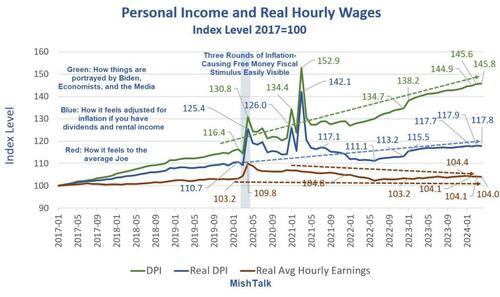
Today the BEA released April data on inflation-adjusted income and spending. Let’s discuss the charts.
Data from the BEA and BLS, chart by Mish
Personal Income and Wages Key Points
DPI stands for Disposable Person Income. Disposable means after taxes.
Real means inflation adjusted.
Income includes wages, dividends, rent and all sources of income.
Workers who don’t receive dividends or rental income view the world as shown by the red lines. Those who have no assets are renters.
Index of Hourly Wages and Multiple Jobholders
One reason Disposable Personal Income is up: People need to work multiple jobs just to make ends meet.
This is also reflected in the blue line in the lead chart.
Personal Income Four Ways
Personal Current Transfer Receipts
The above chart introduces Personal Current Transfer Receipts (PCTR). PCTR is income for which no goods were produced and no work performed.
PCTR includes Medicare, Medicaid, disability payments, food stamps, rent assistance, and Social Security.
PCTR is included in Disposable Income in all of the above charts.
The green line in the above chart shows Real DPI minus PCTR. Please compare the green line to the red line.
PCTR as a Percentage of Real Personal Income
Hoot of the Day
One of the reasons people are angry is the inflation-causing free money ran out. People increasingly have to work multiple jobs to make ends meet.
CPI Up 0.3 Percent With Rent Still Rising Steeply
Rent rose another 0.4 percent in April. Food and beverages were flat with food at home declining but food away from home rising.
CPI data from the BLS, chart by Mish
Key CPI Points
Rent is up at least 0.4 percent for 32 consecutive months.
The CPI weighs rent much higher than PCE. That’s why the CPI is up 3.6 percent from a year ago and PCE only 2.7 percent.
All of the preceding income charts would look much worse if adjusted by the CPI rather than the PCE price index.
Please read those points again. The first three income charts are worse than they look if adjusted by the CPI.
For discussion and additional CPI charts, please see CPI Up 0.3 Percent With Rent Still Rising Steeply
Rent of primary residence, the cost that best equates to the rent people pay, jumped another 0.4 percent in April. Rent of primary residence has gone up at least 0.4 percent for 32 consecutive months!
Home Prices Hit New Record High, Don’t Worry, It’s Not Inflation
The Case-Shiller national home price index hit a new high in February. Economists don’t count this as inflation.
This is a bonus image.
Case-Shiller national and 10-city indexes via St. Louis Fed, OER, CPI, and Rent from the BLS
On May 2, I sarcastically commented Home Prices Hit New Record High, Don’t Worry, It’s Not Inflation
That chart is one month stale now. We hit another new record in March.
The Fed’s Preferred Inflation Measure, PCE, Shows No Further Progress
More weakening: Real (inflation-adjusted) Income and spending was negative in April. The PCE price index remained flat at 0.3 percent for the month and 2.7 percent for the year.
Chart from the BEA, annotations by Mish
Earlier today I noted The Fed’s Preferred Inflation Measure, PCE, Shows No Further Progress
This post contains four charts related to personal income and outlays discussed above.
Anger Synopsis
Consumers are angry, and it’s reflected in the polls. I have been discussing the reasons for angry consumers all year.
But Biden and most economists still don’t get it. They think the economy is doing well. Tell that to renters looking to buy a home, stuck with rent going up month after month.
People Who Rent Will Decide the 2024 Presidential Election
On April 20, I wrote People Who Rent Will Decide the 2024 Presidential Election
Who Are the Renters?
The answer is younger voters and blacks.
The Apartment List 2023 Millennial Homeownership Report shows Millennial homeownership seriously lags other generations.
Generation Z homeownership is dramatically lower still.
And according to the National Association of Realtors, the homeownership rate among Black Americans is 44 percent whereas for White Americans it’s 72.7 percent.
That’s the largest Black-White homeownership rate gap in a decade.
Will the Conviction of Trump Matter?
I doubt it. People will vote with their pocketbook.
For discussion of the political side, please see Trump Found Guilty – a Travesty of Justice for America
If you are not interested in politics, please ignore that link and focus on the rest of this post.
Returning to the economy, inflation will finally come down when rent abates but there will be a price. The price is recession.
I expect a recession this year. It will not surprise me at all if a recession started in 2024 Q2, perhaps April.
Tyler Durden
Sat, 06/01/2024 – 14:00

