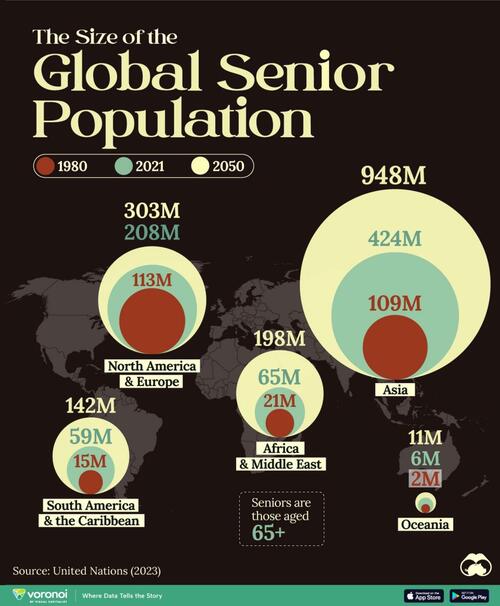
Visualizing The Size Of The Global Senior Population
The growth of the senior population is a consequence of the demographic transition towards longer and healthier lives. Population aging, however, can pose economic and social challenges.
Here, Visual Capitalist’s Marcus Lu maps the size of the world’s population aged 65+ for 1980, 2021, and 2050 (projected). The data is from the World Social Report 2023 by the United Nations.
Global Aging
Currently, population aging is most advanced in Europe, Northern America, Australia, New Zealand, and parts Eastern and Southeastern Asia.
According to the UN, in most countries in these regions, the proportion of older persons exceeds 10%, and in some cases, 20% of the total population.
Most parts of sub-Saharan Africa and Oceania (excluding Australia and New Zealand) are still in an early stage of this transition, while most countries in Central and Southern Asia, Western Asia and Northern Africa, Latin America, and the Caribbean are at an intermediate stage.
The size of the world’s senior population isn’t just growing in absolute numbers; it’s also growing as a share of the overall total. For example, in 2021, 1 in 10 people worldwide were over 65. By 2050, this is likely to be around 1 in 6.
While the shift towards older populations is largely irreversible, some critical measures are necessary to guarantee this transition. These include financial support for the senior population through pension plans, budgeting healthcare and long-term care costs, and implementing measures to adapt and innovate in labor markets to include seniors.
The Global Senior Population in 2100
What will the global senior population look like in the future? For more on that, look at this chart which highlights aging projections by country based on data and projections from the United Nations.
Tyler Durden
Wed, 05/01/2024 – 23:25

