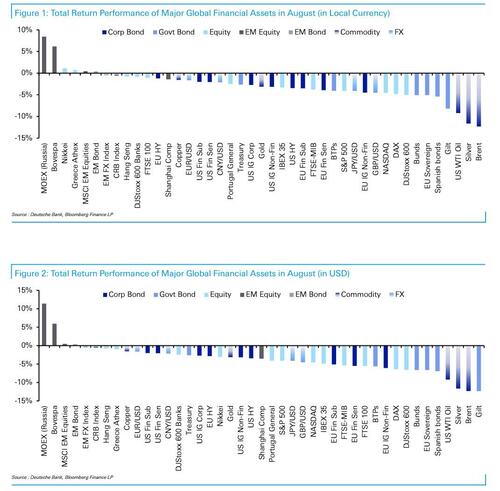
Here Are The Best And Worst Performing Assets In August And YTD
As DB’s Henry Allen writes, August was a month of two halves for markets.
At the start there was a great deal of optimism and risk assets built on their gains from July. That was aided by a much stronger-than-expected US jobs report on August 5th, where the total number of nonfarm payrolls exceeded their pre-pandemic peak for the first time. And then on August 10th we had a much lower-than-expected CPI reading as well, which led to growing hopes that we may have seen “peak inflation” and the Fed wouldn’t need to be so aggressive at hiking rates.
Indeed, if one had down this performance review on August 15, then 23/38 assets would have been in positive territory. But around the halfway point – literally the day Michael Hartnett said to “start shorting the S&P now” – that positive mood turned as if on a dime, and by month’s end, just 6 of 38 assets were positive.
In particular, there was a pronounced selloff after Fed Chair Powell delivered a hawkish message in his speech at Jackson Hole. In his remarks, Powell said that getting back to price stability would “likely require maintaining a restrictive policy stance for some time”, which in turn triggered substantial losses for markets as they began to price in a faster pace of rate hikes. That pattern was seen even more prominently in Europe, where sovereign bonds had their worst monthly performance since the Iboxx series that we use begins. That came as Euro Area inflation rose to a record high since the single currency’s formation, with the flash reading for August coming in at +9.1%.
In addition, the hawkish rhetoric from ECB officials continued to ramp up, with the idea of a 75bps hike at the September meeting being openly floated. Indeed, by the end of the month, overnight index swaps were pricing in a further 169bps worth of ECB hikes at the remaining three meetings this year, equivalent to at least 50bps per meeting.
The growing concern about European inflation followed a substantial rise in energy prices over the last month as well. Natural gas futures rose a further +25.7% over the month as a whole to €240 per megawatt-hour. German power prices for next year also rose +59.4% to €576 per megawatt-hour, which continues their run of advancing every month so far this year. Furthermore, the intraday ranges were astonishing, with German power for next year moving as high as €1050 per megawatt-hour at one point.
By the end of the month, the Nord Stream pipeline had also closed for 3-day maintenance, but concerns remain as to whether gas flows will resume afterwards, similar to the July shutdown.
This shift in the outlook meant 2yr government bond yields in Europe saw some of their largest monthly rises in decades. For instance, German 2yr yields rose +92bps on the month, which marks their largest rise since 1981. Similarly, 2yr yields in the UK were up +131bps, marking their largest rise since 1986. And in France, the rise of +80bps was the largest in available data going back to 1987.
Which assets saw the biggest gains in August?
Natural Gas: European natural gas futures rose +25.7% over the month, as concerns about a Russian gas cutoff persisted. The gains leave prices up almost 5-fold on their levels a year earlier. There was a smaller rise in the US as well, with futures up +10.9%.
US Dollar: The dollar continued to strengthen against other currencies in August, with a +2.6% gain for the dollar index. At points we even saw the Euro fall to parity against the Dollar, although by the end of the month it had recovered to close at $1.0054. Meanwhile sterling had its worst month against the US Dollar since October 2016, weakening -4.5%.
Which assets saw the biggest losses in August?
Sovereign Bonds: Faster-than-expected inflation in Europe, as well as more hawkish central banks meant that sovereign bonds lost significant ground over August. In Europe, the -5.1% decline was actually the largest since the Iboxx series we use began back in the late 1990s, and it was the same for gilts (-8.2%) as well. Treasuries were a relative outperformer, although even they fell -2.6%, as the inflation picture became more promising in the US relative to Europe.
Equities: The prospect of faster rate hikes and some weak data releases meant equities lost ground again in August. The S&P 500 was down -4.1% on a total return basis, and in Europe the STOXX 600 was down -5.0%. One exception to this pattern was in emerging markets, with the MSCI EM index posting a modest +0.4% gain for the month.
Credit: Every credit index in our table lost ground over the last month across USD, EUR and GBP. As with sovereign bonds, GBP credit was the worst affected, with IG non-fin down by -6.8% on the month. That said, even as the credit indices lost ground on a total return basis, EU HY spreads did actually tighten over the month, continuing the trend from July.
Oil: In spite of the gains for other energy commodities, Brent crude (-12.3%) put in its worst monthly performance since November 2021, back when the Omicron variant began spreading and investors became concerned about further lockdowns. August also marked the first time since the pandemic began that Brent crude has fallen for 3 months in a row. The declines for oil have come amidst concern about slowing global growth, as well as the potential for a revival of the Iran nuclear deal. That said, oil remains a top performer on a YTD basis, with Brent crude up by +24.1% since the start of the year.
And visually, these are the best and worst assets in August:
… and YTD:
Tyler Durden
Thu, 09/01/2022 – 17:00

