Housing Affordability Index Drops To Lowest Rate Since 1989, Still Way Too High
Authored by Mike Shedlock via MishTalk.com,
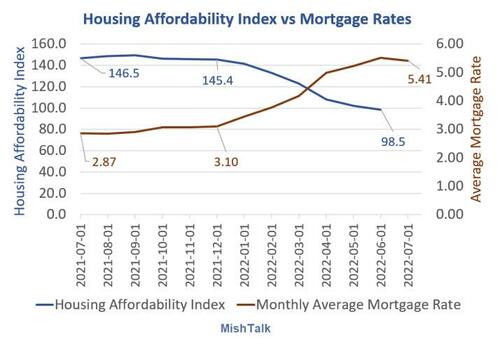
The National Association of Realtors says “affordability” dropped to 98.5 in June, the lowest since 1989.
Housing Affordability Index and mortgage rates via St. Louis Fed.
Affordability in June Was the Worst Since 1989
The Wall Street Journal reports Affordability in June Was the Worst Since 1989
It was more expensive to buy a U.S. home in June than it has been for any month in more than three decades, as record-high home prices collided with a surge in mortgage rates.
The National Association of Realtors’ housing-affordability index, which factors in family incomes, mortgage rates and the sales price for existing single-family homes, fell to 98.5 in June, the association said Friday. That marked the lowest level since June 1989, when the index stood at 98.3.
Housing Affordability Index
The NAR’s Housing Affordability Index is based on median income data current through 2017, projected forward.
Only 13 months of data is available on Fred, the St. Louis Fed repository.
Affordability is based on whether the median family earns enough income to qualify for a 30-year fixed mortgage loan on the median single-family home without spending more than 25% of the income on payment for principal and interest.
An index value of 100 means that a family with the median income has exactly enough income to qualify for a mortgage on a median-priced home. An index above 100 means a median family has more than enough income to qualify for a mortgage loan on a median-priced home, assuming a 20 percent down payment.
Inquiring minds may wish to look at the NAR’s Housing Affordability Index Calculations.
Curiously, the NAR concludes the median household can nearly always afford the median home price.
Do you believe that? More importantly, even if accurate, so what?
The median person who can afford a home and wants a home probably already has a home.
First Time Buyer Index
In terms of new and existing home sales, what matters is what a buyer who does not have a home, but wants a home, is willing to pay and can pay.
The First-Time Buyer Index for 2022 Q2 fell to 68 assuming a starter home price of $351,500.
Can 68 percent of would-be buyers afford (and find) a $351,500 home in a neighborhood in which they want to live?
68 percent is a much more reasonable number than the overall 98.5 percent calculation, but that still strikes me as too high.
Case-Shiller National Home Price Index
I have not updated my full set of Case-Shiller home price charts for a while but that chart is current (May data).
Case-Shiller lags by a few months so it’s even worse than shown.
The pre-pandemic index was 212 and it’s now 306. That’s a 44 percent jump with real median wages declining, property taxes soaring, food soaring, and energy soaring.
Yet, the NAR says that median overall affordability has declined only to the 98.5 percent level. Yeah, right.
Meanwhile, rent and food keep rising and the price of rent will be sticky. Gasoline is more dependent on recession and global supply chains.
Food Prices Rise Most Since February 1979
For more on the price of food, please see Food at Home is Up 13.1 Percent From a Year Ago, Most Since February 1979
For more on rent, please note Tennant’s Unions Demand Biden Declare a National Emergency to Stop Rent Gouging
For more on producer prices please see Producer Prices Decline For the First Time Since the Pandemic Due to Energy
Spotlight on Fed Silliness
The Fed has blown three consecutive bubbles trying to produce two percent consumer inflation while openly promoting raging bubbles in assets especially housing.
* * *
Tyler Durden
Sun, 08/14/2022 – 12:30

