Some More Good Inflation News: Owner-Equivalent Rents Are About To Peak
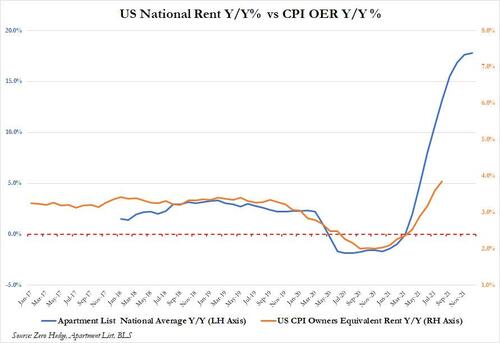
It was seven months ago today, when looking at the latest real-time rent data from the likes of Apartment List and Zillow, we highlighted to readers that the surge in rents has finally peaked as the annual rate of rental increases had capped out at 18% and when Owner-Equivalent Rent – the broadest and most closely watched housing/shelter/rent series in the CPI – was just starting to move higher. This was notable not only because this was around the time the Fed finally realized inflation was not transitory, but also because with its traditional 4-7 month delay, it meant that shelter inflation had already peaked (on an annual basis) and its rate of Y/Y growth was now declining; it also meant that it would take readers of the CPI report – such as the Fed – about 4-7 months to figure out what our readers already knew in January.
Incidentally, this same real-time rental data is what prompted us to correctly warn one year ago (when “team transitory” still ruled supreme), that rental hyperinflation had arrived bringing with it “soaring prices, competition and desperation.”
Well, fast forward to today when the red-hot OER component of CPI, while still red-hot, came in just fractionally below expectations…
… but what is more important is that as the latest Apartment List data shows, the rapid pace of annual increases is now slowing rapidly, and at this pace, the CPI shelter data – which is arguably the stickiest of all and is again delayed 4 to 7 months – will peak some time in September or October.
Courtesy of Apartment List, here are some more observations on the latest real-time trends in the rental market:
Our national index rose by 1.1 percent over the course of July, a slightly slower rate of growth than we observed last month. So far this year, rents are growing more slowly than they did in 2021, but faster than they did in the years immediately preceding the pandemic. Over the first seven months of 2022, rents have increased by a total of 6.7 percent, compared to an increase of 12.0 percent over the same months of 2021. Year-over-year rent growth currently stands at 12.3 percent, but has been trending down since the start of the year from a peak of 18 percent.
On the supply side, our national vacancy index held steady at 5 percent this month. Our vacancy index has been gradually easing from a low of 4.1 percent last fall, but that easing now appears to be leveling off at a rate that remains well below the pre-pandemic norm. This may be at least partially attributable to spiking mortgage rates, which can contribute to tightness in the rental market by sidelining potential first-time homebuyers from the for-sale market and keeping these households in rental units for longer. Rents increased this month in 87 of the nation’s 100 largest cities. The Miami metro has seen the nation’s fastest rent growth over the past year, but elsewhere in the Sun Belt, the booming Phoenix and Las Vegas markets have shown signs of cooling in recent months.
Month-over-month rent growth cools slightly with 1.1% increase; rents up 12.3% year-over-year
The national median rent increased by a record-setting 17.6 percent over the course of 2021. This rapid growth in rent prices is a key contributor to overall inflation, which is currently rising at its fastest pace in 40 years.1 With inflation top-of-mind for policymakers and everyday Americans alike, our rent index is particularly relevant, since movements in market rents lead movements in average rents paid. As a result, our index can signal what is likely ahead for the housing component of the official inflation estimates produced by the Bureau of Labor Statistics. Thankfully for the country’s renters, our index shows that rent growth in 2022 has cooled from last summer’s peaks. At the same time, however, rents are continuing to rise faster than they did in pre-pandemic years.
In the seven months of this year, our national rent index has increased by 6.7 percent, well below last year’s 12.0 percent increase over the same months. However, this year’s pace is also still notably faster than that of the years prior to 2021. For comparison, rent growth from January to July totalled 4.0 percent in 2017, 4.5 percent in 2018, 4.1 percent in 2019, and -0.4 percent in 2020. Rent growth is pacing well behind last summer’s scorching pace, but ahead of the pre-pandemic norm, as can also be seen in the following chart of month-over-month growth from 2018 to present.
Our national rent index increased by 1.1 percent month-over-month in July, representing a slight cooldown from last month’s 1.4 percent increase. In July 2021, our national rent index logged record-setting month-over-month growth of 2.7 percent, more than doubling this month’s increase. In contrast, from 2017 to 2019, month-over-month growth in July averaged 0.6 percent, just over half of this month’s increase. Over the past 12 months as a whole, rent prices have spiked by a staggering 12.3 percent nationally. That said, our year-over-year growth estimate has been gradually cooling in recent months after peaking at 18 percent last December, as monthly growth comes in slower than last year’s pace. This month’s slowing rate of growth is consistent with the timing of seasonal trends that we have observed in the past, and it is likely that growth will cool further in the coming months, as the fall and winter tend to bring a slowdown in rental market activity.
More here
Tyler Durden
Wed, 08/10/2022 – 18:00

