2024 Review – Another 20% Year. What’s Next?
Authored by Lance Roberts via RealInvestmentAdvice.com,
Santa Is A No-Show
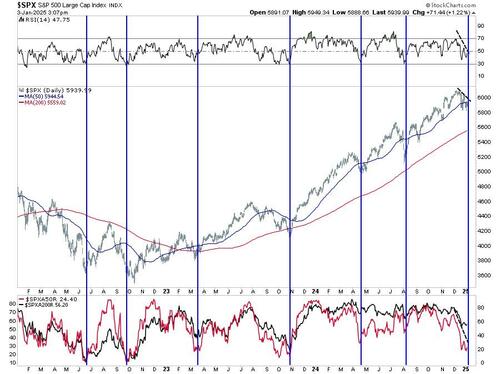
Last week, we discussed how it seemed as if Santa arrived on Christmas Eve, pushing the markets back above the important 50-DMA. However, by the end of the year, it seemed investors were naughty this year and received a “lump of coal,“ with markets selling off back toward recent lows. One important note was that momentum and relative strength remained weak, keeping selling pressure intact.
There is no way to sugarcoat the market’s poor performance. While December started with a bang, it ended with a whimper, with a long stretch of daily losses into year-end. Now, 2025 is opening with a whimper. Small caps fell apart after attempting to “make a comeback,” and overall market breadth declined. However, with the markets now oversold, we should expect a rally heading into the Presidential inauguration, which likely started on Friday.
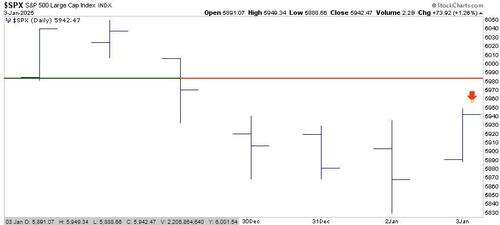
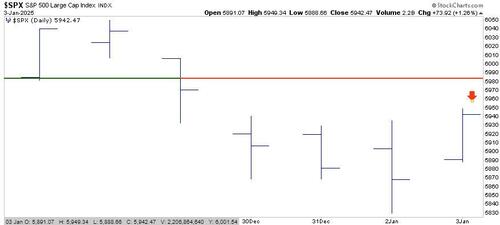
Despite Friday’s impressive reflexive rally, the market fell about 0.5% short of rallying enough to save the “Santa Rally.”
However, although the “Santa Rally” failed to materialize, bullish hopes for 2025 are not yet lost.
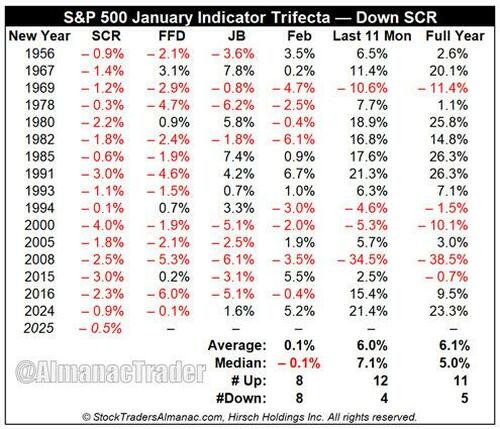
“Since 1950, when all three January indicators (The Santa Claus Rally (SCR), First Five Days (FFD) and the full-month January Barometer (JB)) are up, the S&P 500 was up 90.6% of the time (29 out of 32 years) with an average gain of 17.7%. When one or more of the Trifecta is down, in this case, the SCR, the year is up 59.5% of the time (25 of 42) with a paltry average gain of 2.9%.” – Stocktraders Almanac
While the lack of a Santa rally is disappointing, as noted by Stocktraders Almanac:
“Of the 16 down SCRs since 1950, 11 years have been up and 5 down, but the average gain is a tepid 6.1%.“
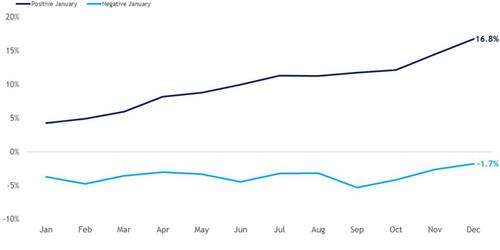
However, even with a failed Santa rally, the January barometer holds the key for the year. Historically, a positive January has been a bullish sign for stocks. The chart below highlights that the popular Wall Street maxim has stood the test of time. Since 1950, the S&P 500 has posted an average annual return of 16.8% during years that included a positive January. Furthermore, the index generated positive returns in 89% of these years. In contrast, when the index traded lower in January, annual returns dropped to -1.7%, with only 50% of occurrences yielding positive results.
With the bulls needing a positive January performance, the market has its work cut out. However, with the market’s short-term oversold and breadth, there is a reasonable technical setup for an improvement in performance in January.
However, will 2025 be another banner year? Maybe. But the market certainly faces headwinds, from elevated earnings expectations to valuations. Our best guess is that while this year will likely see a continuation of the bull market cycle, it will be punctuated by increased bouts of volatility that will weigh on investor sentiment. In other words, “buckle up and keep your arms and belongings inside the vehicle.”
This week, we will do a short 2024 review.
2024 Review – Another 20% Plus Year
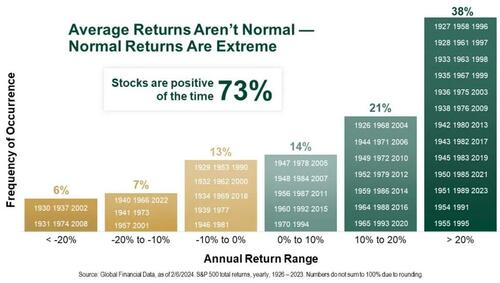
The market had another 20% plus return for the year. As we discussed previously, the market rarely delivers an “average” return of 8-10%. About 38% of the time, the market delivers 20% or more returns.
Since 1900, the stock market has “averaged” an 8% annualized rate of return. However, this does NOT mean the market returns 8% every year. As we discussed recently, several key facts about markets should be understood. Stocks rise more often than they fall: Historically, the stock market increases about 73% of the time. The other 27% of the time, market corrections reverse the excesses of previous advances. The table below shows the dispersion of returns over time.”
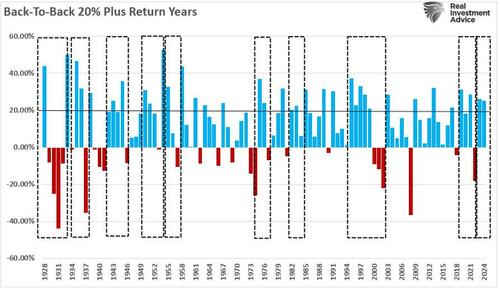
For analysts, being permanently “bullish” leads to a 73% success rate on market calls, which, if you are a professional baseball player, a .730 batting average will enshrine you in the “Hall Of Fame.” However, as investors, the problem with being always bullish is the impact on our portfolios for the “other” 27% of outcomes. This is important in the history of 20% plus annual returns. In the table above, in the far-right column, there are periods where 20% plus gains were clustered.
So, what does that mean?
The Long Term
It is worth noting that these periods of “well-above-average” returns were followed by “well-below-average” returns. As shown, these periods of “mean-reversion” were generally triggered by some event that reversed elevated valuation levels.
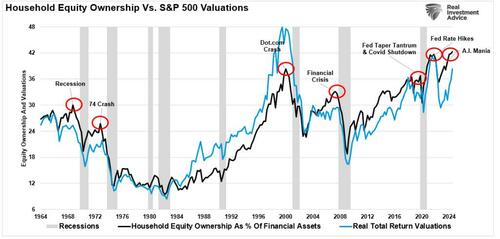
As we see in the market, these periods of excess valuations are a psychological byproduct of investor sentiment. Our 2024 review found that investor allocations to equities reached a record, corresponding to a sharp increase in valuation levels as investors were willing to overpay for earnings growth.
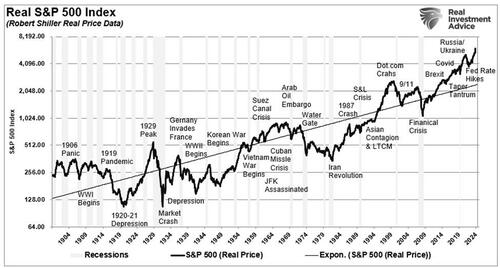
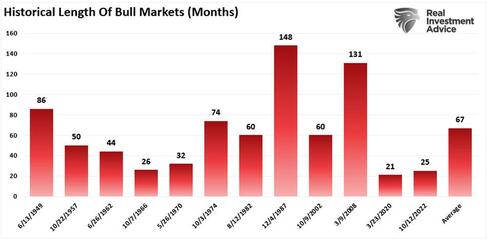
As asset prices rise, speculation. increases, creating a “feedback loop.” The more asset prices rise, the more confident investors become, leading to further price increases fueling a bull market. The chart below shows the length of previous bull markets throughout history, with the average length of bull markets running about 5 1/2 years.
However, while the long duration of bull markets favors being bullish, the problem is that eventually, some “event” occurs that causes a reversal of expectations. When that occurs, investors reprice the market back to reality. As shown, bear markets and the ensuing recessions are generally very short. Most bear markets last less than 18 months and are more painful experiences.
Does that mean 2025 will be a “mean reverting” year? No. However, as discussed in this 2024 review, there are certain warning signs that next year could be very different.
2024 Review – A Year Of Concentration
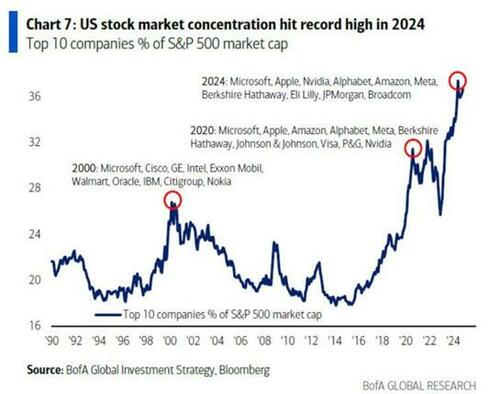
For the second year in a row, the one big standout was the level of market concentration. The “Mega-cap” stocks have become an ever-increasing percentage of the S&P 500 index. We have not witnessed this since the early 70s with the “Nifty-Fifty” and just before the “Dot.com” crash.
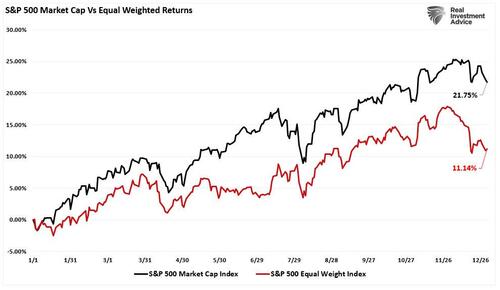
Over the last few years, capital flows into the largest market capitalization stocks have led to an increasing skew between the “have and have nots.” Over the last year, the companies that dominate the market capitalization weighting of the S&P 500 index created a substantial outperformance over the equal-weighted index.
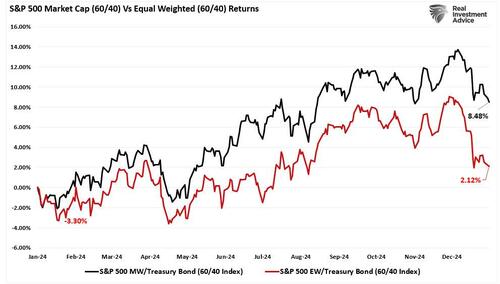
Speaking of the “have-nots,” the 60/40 allocation lagged far behind the S&P 500 index on a performance basis as bonds struggled with “sticky inflation” and continued to push to increase portfolio risk as investors chased asset prices higher.
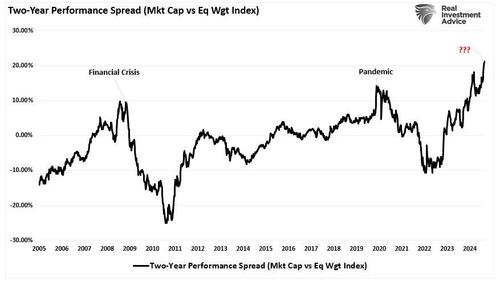
However, that continued performance chase has led to the most significant rolling two-year performance spread between the market capitalization and equal-weighted index since 2008 and 2019.
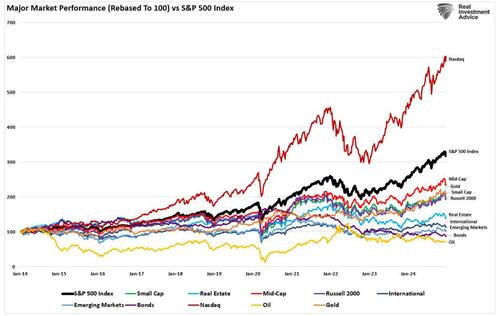
While the surge in market concentration has been notable over the last two years, the chase for performance has been a growing issue since 2014. As shown, the Nasdaq and S&P 500 (both market-capitalization-weighted and dominated by the same stocks) have massively outperformed everything from small and mid-capitalization companies to gold, oil, and bonds.
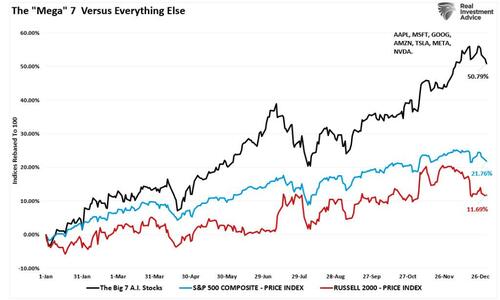
Notably, in 2024, the “Mega 7” market-capitalization companies returned 50%, while the S&P 500 was higher by 22%, and the Russell 2000 trailed far behind, rising just 12%.
The question is, why is this happening?
2024 Review – Speculation Goes Parabolic
As discussed, the surge in “Exchange-Traded Funds” or “ETFs” has changed the investing landscape.
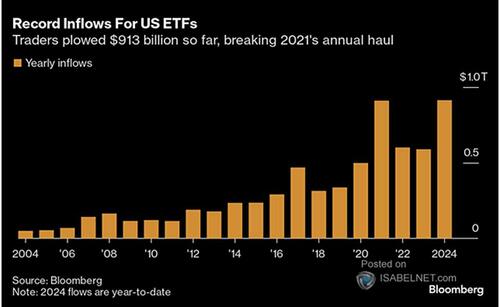
“Following the 2020 pandemic shutdown, the Government and Federal Reserve went into overdrive, providing round after round of fiscal and monetary support. Money flooded the economy, from PPP Loans to rent moratoriums, $1500 checks directly to consumers, debt forgiveness, zero interest rates, and quantitative easing. Unsurprisingly, much of that money entered the financial markets, and retail investors plowed nearly $900 billion in market-related ETFs. Interestingly, in 2024, most of those supports are gone, interest rates have risen sharply, and the Federal Reserve is reducing its balance sheet. Yet, somehow, investors figured out a way to push $913 billion (YTD) into ETFs, which is a record inflow.”
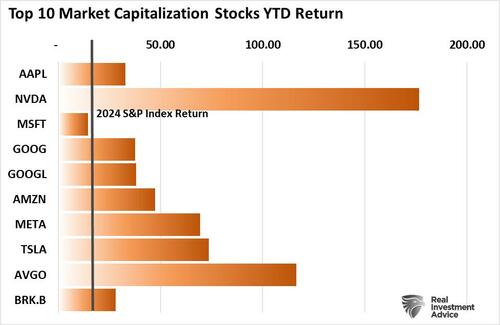
That surge of capital into ETFs contributed to the outsized performance of large capitalization companies, primarily the “Magnificent 7,” relative to the rest of the index, as shown above. This happens because most of these passive ETFs are market capitalization-weighted.
For example, every ETF that tracks the S&P 500 index, the Nasdaq, or some variation thereof has the same top holdings. Currently, the top 10 stocks comprise roughly 40% of those ETFs.
Therefore, every time someone invests $1 into one of those ETFs, roughly 40 cents of that dollar flows into just 10 stocks. Such is why, in our 2024 review, those 10 stocks, except Microsoft, outperformed the S&P 500 index by a wide margin.
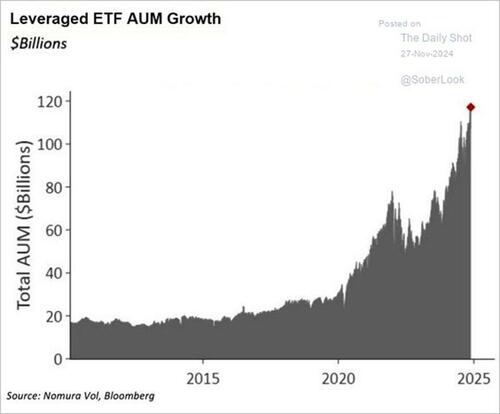
The byproduct of consistently rising prices and investors’ chase for performance creates demand for Wall Street to provide more products for investors to purchase. This is why 2024 saw a massive increase in single-stock ETFs and, more critically, leveraged ETFs.
The growing demand by investors to leverage speculate in the market is a topic we covered recently in our Daily Market Commentary and is the hallmark of our 2024 review:
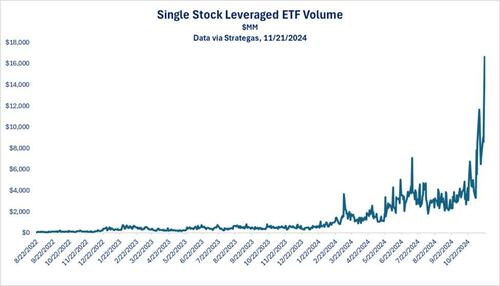
“We see surging volume in leveraged single-stock ETFs. An example of such an ETF is Granite Shares NVDL. The ETF offers a 2x leveraged holding of Nvidia shares. If Nvidia falls by 3%, the ETF will decline by 6%. Conversely, if Nvidia rises by 5%, the ETF will climb 10%. Accordingly, leveraged single-stock ETFs can be incredibly speculative. Furthermore, the massive surge in volume in such ETFs, as we share below, further confirms speculative behaviors are growing.
Leverage and extreme speculation can drive markets higher than most investors forecast. However, in the process, they create a divergence between fundamentals and valuations, thus exposing the markets to risk. Increased leverage and speculation are not reasons to sell immediately, but they indicate that markets are getting frothy, warranting our close attention.“
The important point is that while 2024 was a great year in the markets, history suggests that expectations for 2025 should likely be tempered. Such brings us to the obvious question, “What should I be watching for to signal a shift in investor sentiment?”
2024 Review – What To Watch For In 2025
While investors are giddy with returns over the past year, that exuberance has increased the expectation that things will continue in 2025. Of course, earnings growth will be the biggest driver for returns in 2025.
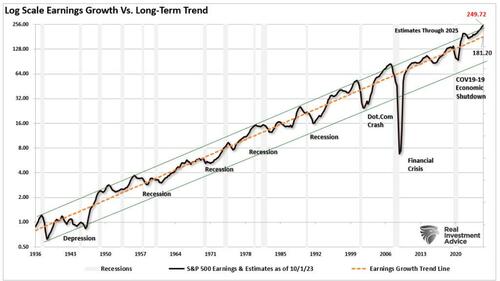
Forward earnings estimates are optimistic and well above their long-term historical logarithmic growth trend. Analysts expect the S&P 500 will see earnings reach $249/share from $208/share at the end of 2024. That is an expected growth rate of 19% for earnings. However, that current estimate is $68/share above historical earnings’ long-term exponential growth trend. While such deviations existed previously, they were usually close to the point where such optimism ended. The ends of those exuberant periods of earnings growth generally coincided with a recession or a mean-reverting event. However, while estimates are currently very elevated, they can remain elevated longer than you think possible.
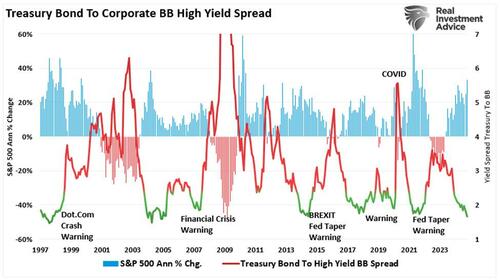
The timing of “the” event that reverses more extreme investor exuberance and speculation is always the most challenging. However, it always occurs when it is least expected. As we enter 2025, investor sentiment of expected stock returns over the next 12 months is near the highest levels on record. At the same time, credit spreads remain near the lowest levels on record, confirming the high degree of complacency in today’s markets.
Such exuberance and overconfidence tend to precede some level of disappointment.
Earnings Matter More Than You Think
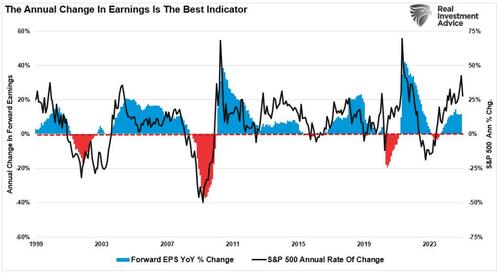
The most significant risk in 2025 is an event that causes a significant decline in earnings expectations. As shown, there is a very high correlation between earnings trends and the rate of change in asset prices.
As I discussed in “Predictions For 2025:”
“The problem with current forward estimates is that several factors must exist to sustain historically high earnings growth.
- Economic growth must remain more robust than the average 20-year growth rate.
- Wage and labor growth must reverse to sustain historically elevated profit margins, and,
- Both interest rates and inflation must reverse to very low levels.
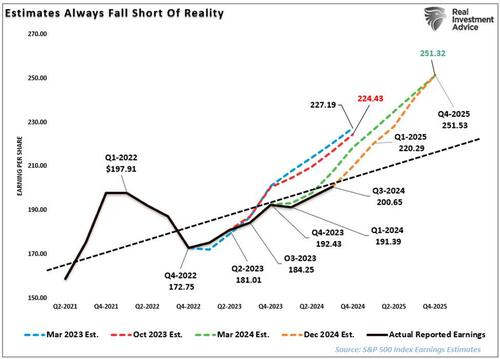
While such is possible, the probabilities are low, as strong economic growth cannot exist in a low inflation and interest-rate environment. More notably, if the Fed cuts rates further, as most economists and analysts expect next year, such will be in response to a slowing economic environment or financial stress. Such would not support more optimistic earnings estimates of $251 per share next year. This represents roughly a 19% increase from Q4-2024 levels. (In 2023, estimates for 2024 suggested a 14% increase, which was just 9%. The long-term trend of earnings growth from 1900 to the present is just 7.7%).”
While the bullish predictions for next year are certainly possible, that outcome faces many challenges. This is particularly true given that the market trades at fairly lofty valuations. Even in a “soft landing” environment, earnings should weaken, which makes current valuations at 27x earnings more challenging to sustain. Therefore, assuming earnings decline toward their long-term trend, that would suggest current estimates fall to $220/share by the end of 2025. This substantially changes the outlook for stocks.
Tyler Durden
Sat, 01/04/2025 – 17:30

