Los Angeles Has The Highest Home Price-To-Income Ratio In The US
Many Americans continue to find homeownership financially out of reach due to rising house prices and stagnant wages, among other contributing factors. But which U.S. cities are the least affordable?
One way to assess housing affordability is through the home price-to-income ratio, which measures the ratio of the median home price to the median household income.
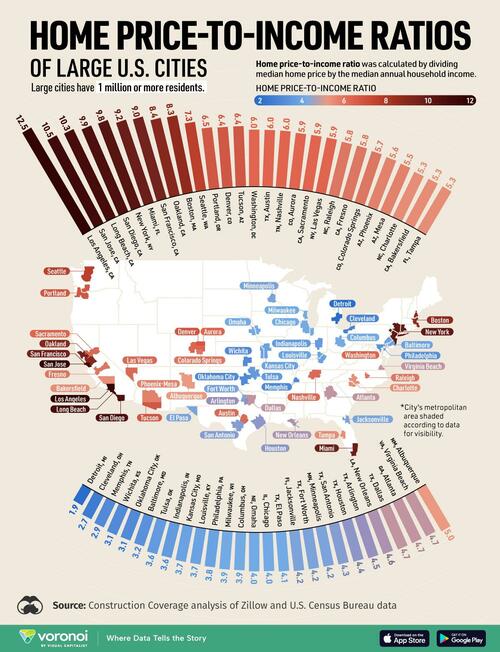
This map, via Visual Capitalist’s Kayla Zhu, shows the home price-to-income ratio of 54 large cities (population over one million) in the U.S. using data from Construction Coverage’s analysis of Zillow and U.S. Census Bureau data.
Housing Affordability Worst in Coastal U.S. Cities
Below, we show the home price-to-income ratio, median home price, and median household income, for 54 large cities in the United States of America.
Rank
City
State
Price-to-income
Median home price
Median household income
1
Los Angeles
CA
12.5
$953,501
$76,135
2
San Jose
CA
10.5
$1,406,957
$133,835
3
Long Beach
CA
10.3
$825,502
$80,493
4
San Diego
CA
9.9
$994,023
$100,010
5
New York
NY
9.8
$732,594
$74,694
6
Miami
FL
9.2
$558,873
$60,989
7
San Francisco
CA
9
$1,236,502
$136,692
8
Oakland
CA
8.4
$780,188
$93,146
9
Boston
MA
8.3
$718,233
$86,331
10
Seattle
WA
7.3
$847,419
$115,409
11
Portland
OR
6.5
$524,870
$81,119
12
Denver
CO
6.4
$563,372
$88,213
13
Tucson
AZ
6.4
$327,123
$51,281
14
Washington
DC
6
$610,180
$101,027
15
Austin
TX
6
$533,719
$89,415
16
Nashville
TN
6
$432,592
$71,767
17
Aurora
CO
5.9
$483,228
$81,395
18
Sacramento
CA
5.9
$472,412
$80,254
19
Las Vegas
NV
5.9
$407,969
$68,905
20
Raleigh
NC
5.8
$434,407
$75,424
21
Fresno
CA
5.8
$370,798
$64,196
22
Colorado Springs
CO
5.7
$449,123
$78,568
23
Phoenix
AZ
5.6
$422,001
$75,969
24
Mesa
AZ
5.5
$434,369
$79,496
25
Charlotte
NC
5.3
$391,750
$74,401
26
Bakersfield
CA
5.3
$380,862
$72,017
27
Tampa
FL
5.3
$375,241
$71,089
28
Albuquerque
NM
5
$321,411
$64,757
29
Virginia Beach
VA
4.7
$391,244
$83,245
30
Atlanta
GA
4.7
$390,373
$83,251
31
Dallas
TX
4.7
$307,990
$65,400
32
New Orleans
LA
4.6
$241,369
$52,322
33
Arlington
TX
4.5
$315,222
$70,433
34
Houston
TX
4.4
$264,626
$60,426
35
San Antonio
TX
4.3
$253,762
$58,829
36
Minneapolis
MN
4.2
$312,872
$74,473
37
Fort Worth
TX
4.2
$302,359
$71,527
38
Jacksonville
FL
4.2
$294,450
$69,309
39
El Paso
TX
4.1
$216,673
$52,645
40
Chicago
IL
4
$284,818
$70,386
41
Omaha
NE
4
$272,286
$67,450
42
Columbus
OH
3.9
$238,286
$61,727
43
Milwaukee
WI
3.9
$191,149
$49,270
44
Philadelphia
PA
3.8
$215,593
$56,517
45
Louisville
KY
3.7
$233,464
$63,049
46
Kansas City
MO
3.7
$230,526
$62,175
47
Indianapolis
IN
3.6
$218,591
$61,501
48
Tulsa
OK
3.6
$194,784
$54,040
49
Baltimore
MD
3.2
$177,786
$55,198
50
Oklahoma City
OK
3.1
$198,826
$63,713
51
Wichita
KS
3.1
$186,528
$59,277
52
Memphis
TN
2.9
$144,347
$50,622
53
Cleveland
OH
2.7
$100,734
$37,351
54
Detroit
MI
1.9
$68,379
$36,453
Cities on the West Coast, particularly in California, face the most significant housing affordability challenges.
The top four cities with the highest ratios are all in California, while other major West Coast cities like San Francisco, Seattle, and Portland rank among the top 15.
The top five cities, including New York City, have a home price-to-income ratio more than double the national average of 4.7, making them highly unaffordable.
While median household income in cities like San Francisco, San Jose, and Seattle are among the highest in the country, they also have some of the most expensive house prices in the country.
The Midwest and parts of the South have much lower ratios, including Detroit (1.9), Cleveland (2.1), and Memphis (3.1). Midwest cities consistently rank among the most affordable for housing and cost of living.
To learn more about the U.S. housing market, graphic that 10 fastest-growing housing markets in the U.S., based on their housing stock growth between 2013 and 2022.
Tyler Durden
Fri, 10/18/2024 – 06:55

