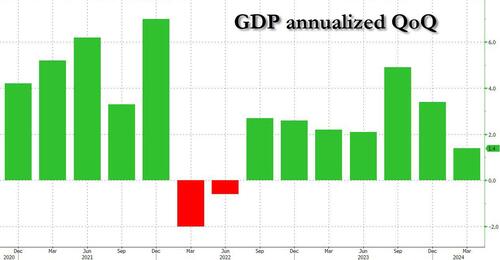
Final Q1 GDP Print Confirms Sharp Consumer Slowdown
While absolutely nobody cared about today’s final Q1 GDP print – which in 3 days will cover a quarter that is more than three months old – there were two notable things about the print: first, the headline number came in fractionally higher than last quarter’s downward revised print, printing at an annualized 1.4% increase, up from 1.3%. That was also right on top of estimates. Despite the slight upward revision to the final number, the 1.4% print was still the lowest since June 22 when the mini technical recession ended.
However, while the overall GDP print came in higher, the composition was decidedly uglier, with Personal Consumption unexpectedly sliding from a 2.0% annualized number to just 1.5% (and a big miss to the 2.0% expected).
This confirms what recent earnings reports from MCD, MMM, KO, POOL, and most recently, Walgreens, have made very clear (and why Goldman recently said to short the middle-income consumer): the US consumer, that pillar supporting 70% of GDP growth, is cracking.
Taking a closer look at the numbers, we find that the sharply reduced increase in consumer spending reflected an increase in services that was partly offset by a decrease in goods. Within services, the leading contributors to the increase were health care as well. In other words, soaring health insurance costs are “boosting” GDP once more. Meanwhile, within goods, the leading contributors to the decrease were motor vehicles and parts as well as gasoline and other energy goods.
The increase in housing investment was led by brokers’ commissions and other ownership transfer costs as well as new single-family housing construction.
The decrease in inventory investment was led by decreases in wholesale trade and manufacturing.
In terms of contribution to the bottom line GDP, here are the key numbers:
Personal consumption was responsible for 0.98% of the bottom line 1.41% GDP growth, a big drop from the 1.34% in the second estimate and almost half the 1.68% consumption in the first estimate!
Fixed investment added 1.19% to the bottom line, up from 1.02% in the previous estimate.
The change in private inventories was almost unchanged from the previous estimate, at -0.42%, up fractionally from -0.45%.
Net trade (exports less imports) subtracted only 0.65%, a revision from the -0.89% in the previous estimate. With the dollar soaring, expect this number to plunge for the Q2 print.
Finally, government consumption managed a modest increase, rising to 0.31%, up from 0.23%.
One final point: while certainly not relevant today, one day ahead of the latest core PCE print, the BEA reported that in Q1, prices rose slightly more than expected, with the GDP price index rising 3.1%, up from 3.0% and the core PCE up 3.7% vs 3.6% previously. Some more details from the report:
Gross domestic purchases prices, the prices of goods and services purchased by U.S. residents, increased 3.1 percent in the first quarter after increasing 1.9 percent in the fourth quarter. Excluding food and energy, prices increased 3.3 percent after increasing 2.1 percent.
Personal consumption expenditures (PCE) prices increased 3.4 percent in the first quarter after increasing 1.8 percent in the fourth quarter. Excluding food and energy, the PCE “core” price index increased 3.7 percent after increasing 2.0 percent.
Bottom line: the stagflationary pressures are rising, with growth about to dip into contraction especially as the consumer is now tapped out, while prices remains very sticky, and while tomorrow’s core PCE may show a modest drop due to a handful of technicalities we will discuss shortly, everyone knows that absent a huge recession (or depression) prices will just keep on ticking higher.
Tyler Durden
Thu, 06/27/2024 – 09:41

