Hedges: The Slow-Motion Execution Of Julian Assange Continues Authored by Chris Hedges via Scheerpost.com, The decision by the High Court...
Read More

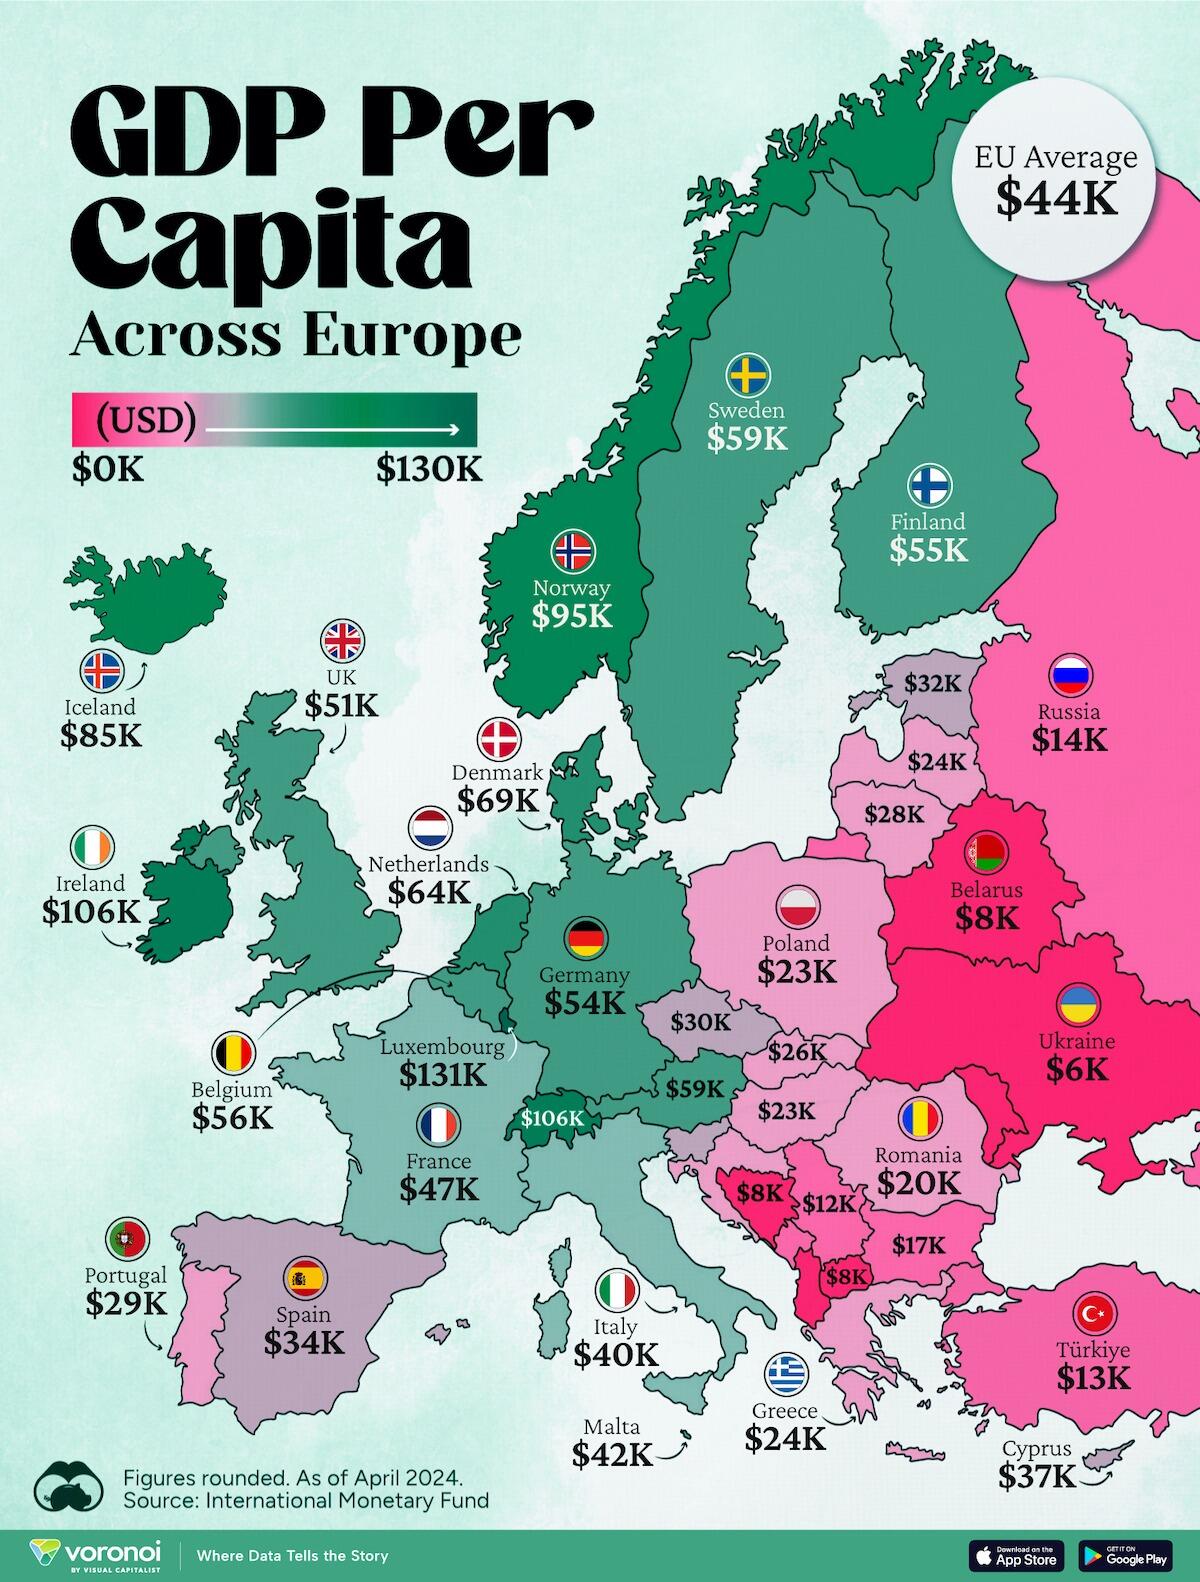
Visualizing Europe’s GDP-Per-Capita By Country
Europe is home to some of the largest and most sophisticated economies in the world. But how do countries in the region compare with each other on a per capita productivity basis?
In this map, Visual Capitalist’s Pallavi Rao shows Europe’s GDP per capita levels across 44 nations in current U.S. dollars.
Data for this visualization and article is sourced from the International Monetary Fund (IMF) via their DataMapper tool, updated April 2024.
Europe’s Richest and Poorest Nations, By GDP Per Capita
Luxembourg, Ireland, and Switzerland, lead the list of Europe’s richest nations by GDP per capita, all above $100,000.
Rank
Country
GDP Per Capita (2024)
1
 Luxembourg
$131,380
2
 Ireland
$106,060
3
 Switzerland
$105,670
4
 Norway
$94,660
5
 Iceland
$84,590
6
 Denmark
$68,900
7
 Netherlands
$63,750
8
 San Marino
$59,410
9
 Austria
$59,230
10
 Sweden
$58,530
11
 Belgium
$55,540
12
 Finland
$55,130
13
 Germany
$54,290
14
 UK
UK
$51,070
15
 France
$47,360
16
 Andorra
$44,900
17
 Malta
Malta
$41,740
18
 Italy
Italy
$39,580
19
 Cyprus
$37,150
20
 Spain
Spain
$34,050
21
 Slovenia
$34,030
22
 Estonia
$31,850
23
 Czech Republic
$29,800
24
 Portugal
$28,970
25
 Lithuania
$28,410
26
 Slovakia
$25,930
27
 Latvia
$24,190
28
 Greece
$23,970
29
 Hungary
$23,320
30
 Poland
$23,010
31
 Croatia
$22,970
32
 Romania
$19,530
33
 Bulgaria
$16,940
34
 Russia
$14,390
35
 Türkiye
$12,760
36
 Montenegro
$12,650
37
 Serbia
$12,380
38
 Albania
$8,920
39
 Bosnia & Herzegovina
$8,420
40
 North Macedonia
$7,690
41
 Belarus
$7,560
42
 Moldova
$7,490
43
 Kosovo
$6,390
44
 Ukraine
$5,660
N/A
 EU Average
$44,200
Note: Figures are rounded.
Three Nordic countries (Norway, Iceland, Denmark) also place highly, between $70,000-90,000. Other Nordic peers, Sweden and Finland rank just outside the top 10, between $55,000-60,000.
Meanwhile, Europe’s biggest economies in absolute terms, Germany, UK, and France, rank closer to the middle of the top 20, with GDP per capitas around $50,000.
Finally, at the end of the scale, Eastern Europe as a whole tends to have much lower per capita GDPs. In that group, Ukraine ranks last, at $5,660.
A Closer Look at Ukraine
For a broader comparison, Ukraine’s per capita GDP is similar to Iran ($5,310), El Salvador ($5,540), and Guatemala ($5,680).
According to experts, Ukraine’s economy has historically underperformed to expectations. After the fall of the Berlin Wall, the economy contracted for five straight years. Its transition to a Western, liberalized economic structure was overshadowed by widespread corruption, a limited taxpool, and few revenue sources.
Politically, its transformation from authoritarian regime to civil democracy has proved difficult, especially when it comes to institution building.
Finally, after the 2022 invasion of the country, Ukraine’s GDP contracted by 30% in a single year—the largest loss since independence. Large scale emigration—to the tune of six million refugees—is also playing a role.
Despite these challenges, the country’s economic growth has somewhat stabilized while fighting continues.
Tyler Durden
Fri, 05/10/2024 – 02:45
Recent Comments