Thursday Humor: What Is The Optimal Temperature For Global GDP Growth?
Authored by Mike Shedlock via MishTalk.com,
A group of climate alarmists have concluded that global GDP will be 23 percent lower on the current path.
I was aware of the ridiculous article when it came out.
I stopped reading when I noted that all countries were all given equal weighting. For example, Nigeria has the same weight as the US.
The authors tried to mitigate this in various ways but it was obvious that the authors would bend the data and the report to match their goals.
Today, I am pleased to present a complete and thorough trashing of the Nature article.
Please consider Global Non-Linear Effect of Temperature on Economic Production: Comment on Burke, Hsiang, and Miguel by David Barker, emphasis mine.
The journal Nature published an influential article in 2015 by Marshall Burke, Solomon M. Hsiang, and Edward Miguel (hereafter BHM) purporting to show that higher temperatures will lower economic growth in warm countries.
The Web of Science reports that the paper is in the top six one hundredths of one percent of economics and business publications by citations, and Google Scholar shows 2,269 citations. BHM (2015) also received significant attention in the popular press. Hsiang further developed this work and cowrote a chapter of the National Climate Assessment (Hsiang et al. 2023) claiming that higher temperatures would reduce the rate of economic growth.
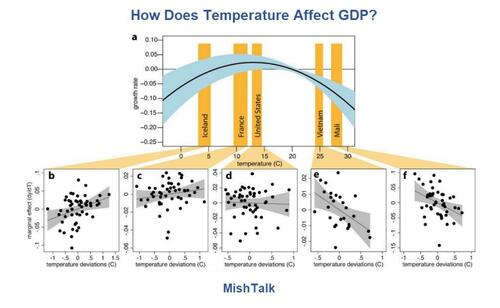
BHM’s analysis is shallow and misleading. The authors use data with characteristics that are known to create spurious regression results without making proper adjustments or even acknowledging these characteristics. They estimate parameters of a quadratic curve relating temperature to growth, and then cherrypick countries to include in a chart that appears to confirm the shape of this curve. The curve is then used to project growth rates into the distant future using temperature scenarios that a more recent comment in Nature described as either “extremely unlikely” or “unlikely”.
Description of BHM (2015)
BHM (2015) use annual data representing 166 countries from 1961 to 2010 on temperature and economic growth. All countries are equally weighted, and every country is assigned a single average temperature for each year. Because some data are missing, there is a total of 6,584 country/year observations instead of the 8,300 that could be used if data from all years in all countries were available.
The headline result of a 23 percent reduction in GDP comes from taking each country’s projected GDP per capita with and without climate change, then taking the weighted average by population, and then taking the percentage difference between the weighted sum with and without climate change.
The headline result, that warming will reduce global GDP per capita by 23 percent, is more than double the mean estimate of BHM’s bootstrap estimation, which they do not report. BHM claim that their result is “globally representative”, but it does not hold without Greenland and the regions of the Sahara and Central Africa, and it does not hold in large regions of the world. Simulations support the hypothesis that spatial autocorrelation may be the cause of BHM’s results, and robustness checks also suggest that their results may be spurious. BHM has been the subject of methodological criticism (Newell et al. 2021; Tol 2019; Rosen 2019), but my paper is the first to precisely document its deceptive practices.
Thesis Falls Apart
Barker notes that if you remove Greenland and regions of the Sahara and Central Africa from the analysis, the entire BHM thesis falls apart.
He also comments on dummy variables and notes that if the analysis started one year earlier, the BHM thesis also falls apart.
On the geek side, Barker notes “Any data, no matter how noisy, will generate a smooth quadratic curve if one variable is regressed on another and its square and the predicted values of the dependent variable are plotted against possible values of the independent variable.”
Thus, the nice smooth graphs of BHM are automatic by design.
Regarding the lead chart, Barker says “Five countries are cherry-picked to make the relationship appear to be significant. While the figure is not a crucial part of BHM’s analysis, it is indicative of the misleading approach of the paper, and suggests alternative methods of measuring the relationship between growth and temperature.“
Much of his rebuttal is complex and not light reading. I picked some highlights that I thought would be generally understandable.
Optimal Temperature
I am confident there is no such a thing as an optimal global temperature. Such a belief precludes technology advances that can mitigate climate impacts.
At best, an optimal temperature is unknowable and changing. And it’s ridiculous to believe we could or should try to hit the optimal temperature even if it exists.
It’s clear BHM had an agenda and manipulated the dates, the countries, the years included, and the dummy variables to produce the desired result.
Forcing the Data to Meet the Non-Science
BHM forced the data not to meet the science, but to meet a belief in non-science. I fail to see what they gain by this.
At best, they now look like a pack of incompetent scientists, and at worst a pack of complete liars.
Cheers From the Cult
The people BHM address are in the same cult and need no convincing. OK, BHM got cheers from the cult. If that was the goal, congrats.
But if the goal was to convince the skeptics, they failed miserably.
Some of us saw through the nonsense right from the beginning. And now we have a stellar rebuttal from David Barker to back us up.
March to Madness Continues
The lie of the day is from the EPA: Carbon capture will pay for itself (thanks to IRA subsidies). No, it won’t even with subsidies. Expect blackouts and a higher price for electricity.
In case you missed it, please see Biden’s New Carbon Capture Mandates Will Cause Blackouts, Increases Prices
The march to energy madness continues.
Tyler Durden
Thu, 05/09/2024 – 23:00

