Renters Surpass Homeowners In 41% Of Zip Codes In The 50 Largest US Cities
Authored by Mike Shedlock via MishTalk.com,
Renting is at the highest level in half a century, with 43.7 million households renting. Population-adjusted numbers are another matter. But what does it mean?
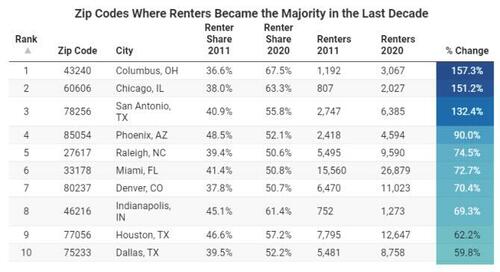
Table courtesy of RentCafe
RentCafe reports 101 Zip Codes Switch From Homeowner to Renter Majority
A diverse set of 23 large and mid-sized cities transitioned from owner- to renter-majority between 2010 and 2020.
Renting is at the highest level in half a century, with 43.7 million households currently living in rentals.
As many as 101 zip codes switched to renter majority in the past decade.
Renters surpass homeowners in 41% of zip codes in the 50 largest US cities.
Downtown areas became more popular for renters in 2020 compared to 10 years prior.
Of the new renter majority zip codes, 43240 in Columbus, OH saw the fastest increase in the number of renters.
San Antonio’s 78215 is the top trending zip code for renters in the nation, tripling its renter population in ten years.
One-third of this decade’s renters now say that it’s a matter of choice.
The first zip code on the list is 43240 in Columbus, OH. About 68% of the people living in Columbus’ 43420 are renters — as a result of a whopping 157% increase in the last 10 years. A densely populated area, the zip code largely overlaps with the Polaris neighborhood, which is home to a community of young renters with a median age of 31. Here, residents earn a per capita income of $43,000 — 25% higher than that of the Columbus metro area, per Census data.
Next up is followed by Chicago’s 60606, which coincides with the West Loop neighborhood. In this area, the number of renters grew by two and a half times in a decade (151%). A thriving community that flaunts a 63% renter population, its residents are mostly Millennials and Gen Zers with high academic achievements.
Renting Peak
Number of Renters courtesy of RentCafe
The number of renters is at a peak but the share of renters is nowhere close to a peak.
HomeOwnership Rate in US
Homeownership rate from St. Louis Fed, annotations by Mish
From 2018 to 2020 bidding wars broke out and home prices accelerated.
As boomers retire, downsize, then die, homeownership rates will decline further, especially with the Fed attempting to burst the housing price bubble it created via QE interest rate suppression.
Mortgage News Daily 30-Year Rate
Mortgage News Daily 30-Year Rate – October 17, 2022
The average 30-year fixed rate mortgage has soared to 7.12 percent.
Home prices have barely started to fall.
Home Prices Start to Decline, How Low and How Fast Will They Fall?
Case-Shiller home price data via St. Louis Fed, chart by Mish
Prices have peaked How Low and How Fast Will They Fall?
Case-Shiller lags. July is the latest data and that represents sales primarily made in May and June so the declines shown are undoubtedly understated.
No one knows for sure. But the longer home prices stay elevated, the longer economic weakness will last.
Existing Home Sales
Existing home sales data via St Louis Fed, chart by Mish
We have not seen downturns like this outside of recessions.
For discussion, please see Existing Home Sales Decline Every Month Since February, Down 0.4 Percent in August
Great Recession Comparison
Unlike the Great Recession, this housing bubble lacks liar loans and the intense speculation of 2005-2008.
Nor will people be walking away from debt because most have positive equity.
On the job front, I expect a minimal rise in unemployment.
Where to From Here?
Prices will slowly decline but 6 and 7 percent interest rates will kill affordability for years to come. Even 15 or 20 percent declines would be insufficient to stir up the massive surge in demand we saw from 2020 on.
Many will become locked to their homes, unable or unwilling to move. Who wants to sell their house with a 2.5% mortgage to buy a home with a 7.0% percent mortgage?
Negative price pressure will come from downsizing or dying boomers and those who have no mortgage.
When children inherit a house, they will sell. There will be a big wave of forced selling in the future, but not now.
Expect a Long Period of Weak Growth, Whether or Not It’s Labeled Recession
Housing tends to lead the economy into and out of recessions. This slowdown is taking a toll on the economy now.
But unless the Fed comes to a quick rescue, housing will be in the doldrums for a long time.
A Big Housing Bust is the Key to Understanding This Recession
Add it all up and you have a long period of slow economic growth that borders in and out of recession for years.
For discussion, please see Expect a Long Period of Weak Growth, Whether or Not It’s Labeled Recession
Housing leads recessions and recoveries and housing rates to be weak for a long time.
Add it all up and you have the opposite of the Covid-recession, a long period of economic weakness with minimal rise in unemployment.
It does not matter whether you label this a recession or not. Besides, the NBER might not even announce the recession until it’s over. That happened once already.
* * *
Like these reports? I hope so, and if you do, please Subscribe to MishTalk Email Alerts.
Tyler Durden
Tue, 10/18/2022 – 14:00

