Volatility And Valuations
Authored by Nick Colas via DataTrek Research,
We will start today’s discussion with two numbers: 5.6 percent and 3.4 percent. Those are the 20-year compounded annual growth rates (CAGR) for the S&P 500 from 1999 – 2018 on a nominal and real (after-inflation) basis. If those strike you as pathetically low, you are correct:
That 5.6 percent nominal return is barely half the S&P’s long run average 20-year CAGR of 10.8 percent.
It is also the worst nominal 20-year CAGR since the period spanning the Great Depression.
The 3.4 percent inflation-adjusted 20-year CAGR is the worst since the 1969 – 1988 timeframe, where the 1980s bull market only barely made up for the inflationary 1970s. Long run inflation-adjusted S&P returns are 7.1 percent, more than double that 3.4 percent result.
Now, one might say that 1999 is an unfair starting point, but the 20-year CAGR data tells much the same story about sub-par or merely average returns across other timeframes:
1997 – 2016: 7.6 percent nominal, 5.5 percent real returns
2002 – 2021: 9.4 percent nominal, 7.1 percent real returns
The reason for these disappointing results for long-term equity investors comes down to two 5-year periods: 1997 – 2002 and 2007 – 2012. In both cases, the S&P 500 went nowhere for half a decade. Returns from 2003 – 2006 were decent, averaging 15 percent with no drawdown years, but that still was not enough to make up for the stagnant bookends on either side of that time span.
Interestingly, it was not corporate earnings power than caused these two “lost” half decades:
S&P 500 earnings were $44.01 in 1997, when the index closed the year at 970. When the S&P got back to that level in Q2 2003, trailing 4 quarter earnings were $48.95/share. That is a difference of 11 percent.
In 2007, the S&P earned $82.54/share and the index finished the year at 1,475. The next time the S&P was at similar levels after the Financial Crisis/Great Recession was in early 2013, when the S&P had earned $98.35/share in the prior 4 quarters. The difference here is 19 percent, but the index was flat from 2007 to 2013.
We cannot blame Interest rates for this contraction in price-earnings multiples. Ten-year Treasury yields were lower in 2003 than 1997 (3 versus 6 percent) and 2013 relative to 2007 (1-2 percent versus 5 percent). If anything, multiples should have recovered more quickly and been higher in 2003 and 2013 and in 1997 and 2007. And yet, they clearly were not.
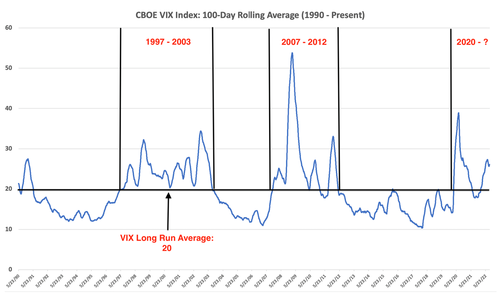
The chart below, which shows the 100-day rolling average of the CBOE VIX Index, offers a reasonable explanation for why US equity valuations contracted over 1997 – 2002 and 2007 – 2012 even with the tailwind of lower interest rates. As highlighted, in both periods the VIX was consistently above its long-run average of 20 for years on end. Yes, the S&P bottomed before the end of each period of volatility (2002 and 2009). The trouble was that valuations remained compressed for far longer than just the 2000 – 2002 and 2008 bear markets. That is why the S&P flatlined for 5 years in each case rather than just 1 – 3 years.
We have highlighted the current VIX running averages on the rightmost part of the graph, and those broadly resemble prior problematic periods for equity valuations. Happily, volatility has not yet overly damaged S&P price-earnings multiples relative to pre-pandemic levels. The S&P trades for 17.5x current earnings power of $228/share. In 2019, PE ratios ran between 18.5 – 19.5x. A bit of a haircut, true, but consistent with higher interest rates so let’s call it a wash.
I do, however, worry about long-lasting equity market volatility far more than I worry about recession. Large public companies know how to make money, even during periods of economic stress, as the data presented above shows. The market-weighted nature of the S&P indexing process constantly resets in favor of businesses that accomplish that task better than others. Recession or no, these are fundamentally positive and permanent features and the cornerstone of our view that US large caps are the most productive asset class for long term investors.
The problem is that volatility grinds away at investor confidence. The longer it lasts, the lower stock valuations go. That is entirely rational, if unwelcomed, but it takes years to regain investors’ trust after a long bout of volatility. That is how you end up with zero stock market returns for 5 years, and subpar returns for periods as long as 2 decades.
I think Chair Powell and the Federal Reserve understand this problem, albeit from the wider perspective of creating an environment consistent with sustainable economic growth. The Fed needs to get inflation under control quickly and permanently, because until they accomplish that goal capital markets volatility will remain high. That will limit capital formation and investment over the longer term, making the next economic cycle weaker than it would otherwise be.
Takeaway: while it may be painful in the near-term, long-term US equity investors should be hoping for very aggressive and effective monetary policy over the next 6-12 months and look to add stock exposure to portfolios as that unfolds.
That will be the pathway to holding equity valuations at current levels and offers the possibility of better multiples in the next cycle.
The alternative – another 1-2 years of uncertainty – would threaten structural returns for 5 years or longer. History is clear on that point.
Tyler Durden
Sun, 09/11/2022 – 21:00

