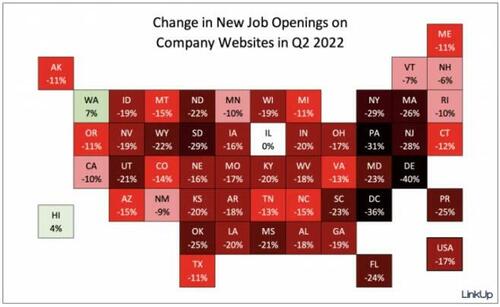
New Job Openings Drop In 47 States, Nationally Down 17%
Authored by Mike Shedlock via MishTalk,
LinkUp has interesting charts on job openings. Let’s investigate.
Change in New Job Openings courtesy of LinkUp
LinkUp reports Job Openings Dropped 3% in June
In June, total job openings dropped 3% while new and removed jobs rose 1% and 3% respectively. Labor demand dropped 10% in the 2nd quarter and with the continued decline in total job openings in June, labor demand has returned once again to where it was last August.
LinkUp 10,000
More Weakness Expected
Based on our June data, we expect to see continued weakening in July’s jobs report that will be released August 5th.
LinkUp Methodology
The LinkUp 10,000 is an analytic, published both daily and monthly, that captures the sum total of U.S. job openings from the 10,000 global employers in LinkUp’s job search engine with the most U.S. job openings. Representing the entire U.S.
BLS JOLTS Methodology
Every month the BLS produces a Job Openings and Labor Turnover Survey (JOLTS).
The JOLTS program provides information on labor demand and turnover. The JOLTS program covers all private nonfarm establishments, as well as federal, state, and local government entities in the 50 states and the District of Columbia. Industries are classified in accordance with the North American Industry Classification System.
The JOLTS survey design is a stratified random sample of 20,700 nonfarm business and government establishments. The sample is stratified by ownership, region, industry sector, and establishment size class. The establishments are drawn from a universe of over 9.4 million establishments compiled by the Quarterly Census of Employment and Wages (QCEW) program which includes all employers subject to state unemployment insurance laws and federal agencies subject to the Unemployment Compensation for Federal Employees program.
Job openings include all positions that are open on the last business day of the reference month. Excluded are positions open only to internal transfers, promotions or demotions, or recall from layoffs. Also excluded are openings for positions with start dates more than 30 days in the future, positions for which employees have been hired but the employees have not yet reported for work, and positions to be filled by employees of temporary help agencies, employee leasing companies, outside contractors, or consultants. The job openings rate is computed by dividing the number of job openings by the sum of employment and job openings and multiplying that quotient by 100.
Timeliness
On July 6, the BLS JOLTs Report showed Job openings decreased to 11.3 million on the last business day of May. Hires and total separations changed little at 6.5 million and 6.0 million, respectively.
On July 7, Linkup posted its charts for the month of June.
Along with the its July 7 post, LinkUp posted its job forecast for June.
Given the lag between job openings being posted on company websites and those jobs being filled with new hires, our non-farm payroll forecast for June is based on our data from May when new and total jobs dropped 9% and 5% respectively. As a result, we are forecasting a net gain of just 265,000 jobs in June.
Jobs Grow by 372,000 but Employment Shrinks by 315,000
Payroll and employment data from the BLS, chart by Mish
Jobs vs Employment
On July 8, I reported Jobs Grow by 372,000 but Employment Shrinks by 315,000
A recession has started yet jobs and employment have not yet returned to the pre-Covid high.
Employment has gone nowhere or down as jobs surge. The employment change since March is -347,000.
See the above link for details.
Expect a Long But Shallow Recession With Minimal Job Losses
Given hiring pressures and boomer retirements, Expect a Long But Shallow Recession With Minimal Job Losses
The stock market is another issue. For discussion, please see Artificial Wealth vs GDP: Why Earnings and the Stock Market Will Get Crushed
* * *
Like these reports? I hope so, and if you do, please Subscribe to MishTalk Email Alerts.
Tyler Durden
Wed, 07/13/2022 – 12:06

