42 Attorneys General Demand Surgeon General Warnings On Social Media In a move that's undoubtedly going to be used to...
Read More

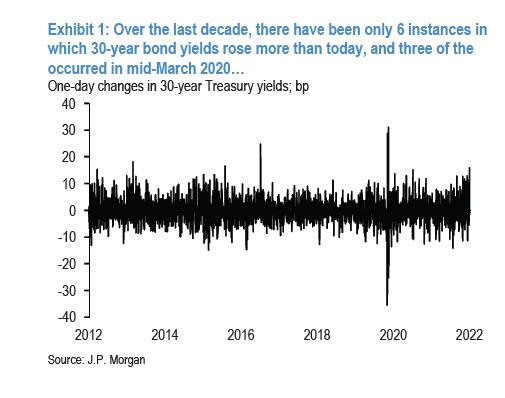
Bond Market Is Breaking: The Last Three Times 30Y Yields Jumped More, The Fed Intervened
Some concerning observations about the state of the bond market from JPMorgan’s Jay Barry (full note available to pro subscribers in the usual place).
We argued yesterday that the sharp decline in front-end yields was exaggerated by the unwind of speculative short positions, but we did not expect for that move to nearly fully reverse today as Treasury yields rose 11-16bp. Given this reversal, it’s tempting to say the market is coalescing on our view; however, we do not think this represents a more hawkish reassessment of yesterday’s FOMC meeting, as the long-end led the way to higher yields.
Notably, there have only been 6 instances over the last decade in which 30-year bond yields rose more than today: the top 3 were all amid the worst of market dysfunction in March 2020 which forced the Fed to intervene in unprecedented fashion, the fourth was the day after the presidential election in 2016, the fifth was a stronger-than-expected payroll release on a low-liquidity Friday around the July 4th holiday in 2013, and the sixth was in December 2015 when the ECB disappointed market’s expectations for additional stimulus
Accordingly, we think it’s critical to explore the drivers of this historic move.
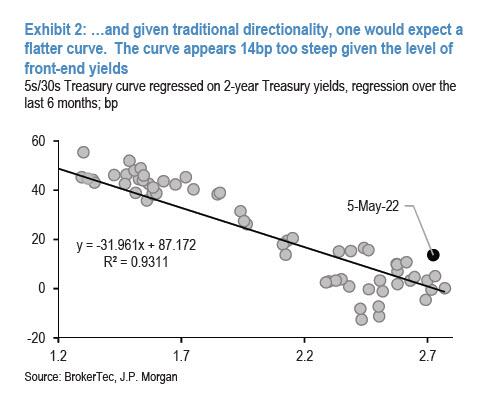
First, it’s hard to say valuations justify this bearish steepening. Over a longer period, when the Fed is on the move, the curve tends to trade counter directionally, flattening as yields rise, and vice versa. As a result, the curve has completely decoupled from the market’s Fed’ expectations: over the last 6 months, 2-year Treasury yields have explained about 93% of the variation in the 5s/30s curve, and given these moves, the curve appears about 14bp too steep (Exhibit 2).
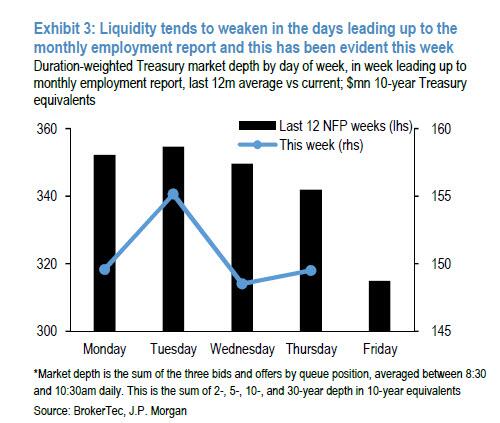
Second, we’ve argued lately that the liquidity backdrop is relatively weak: as we showed yesterday, Treasury market depth has been sitting at levels only seen during the worst of the GFC in late-2008/early-2009 and the COVID-19 pandemic in March 2020. This paints a weaker picture on Treasury market liquidity than the presentation by TBAC. Ten-year Treasury market depth remains near the lowest levels since March 2020. Now poor liquidity in itself does not cause this move, but can be an accelerant in the face of other factors. It’s likely this has been exaggerated by cyclical dynamics, as liquidity tends to weaken in the days leading up to the monthly employment report: this could be exaggerated by the calendar configuration, as today falls the day after the FOMC and the day before the April employment report (Exhibit 3).
Third, risk appetite is light: we’ve highlighted that investors have used the move to higher yields to reduce risk, and Exhibit 4 shows that the share of neutrals in our Treasury Client Survey have been on the rise throughout 2022, matching the highest share since early-March 2020, and the upper end of the range we’ve seen over the past decade. This matters because Treasury is set to auction about $105bn in 10-year Treasury equivalents next week, certainly smaller than the last few months, but still the largest weekly concentration of duration supply over the course of this month.
Tyler Durden
Thu, 05/05/2022 – 22:03