Nomura: “Shock Tightening” In Financial Conditions Is Allowing “Macro Truths” To Override Technicals
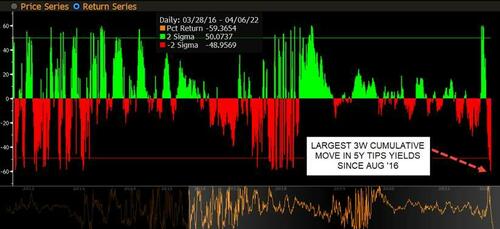
The recent rally in stocks is, macro-wise, incoherent with what has been happening in financial conditions. Specifically, the 1w change in TIPS 2s10s curve was just the largest impulse flattening since the US debt downgrade in Aug ’11 and Dec ’08, while the cumulative 3 wk move in 5Y TIPS yields is the largest since Aug ‘16…
…along with tighter FCI and higher Rate Vol…all while Equities iVol has collapsed…
But, as Nomura’s Charlie McElligott points out in a note this morning, this sudden “shock tightening” in Financial Conditions – as Real Yields are exploding higher (5Y TIPS Yields from -1.66 to current -0.59bps over the past 3 weeks!) – is allowing “macro truths” to finally override recent “bullish” mechanical flows in Equities.
Additionally, Brainard’s much more aggressive QT language is behind another large buyside grab in Credit downside (huge HYG Put Spread buying here and away, and Dealers nearing “Max Short Gamma vs Spot” territory (spot ref 127 vs 125/126 “max short” point…hence the sloppy trading). As traders know from prior episodes, QT is a spread-product widener, negative for MBS and seeping into Credit as FCI tightens, via the push from Fed ownership to the Private side and ensuing return of price-discovery, as there is now “less cash available to help absorb more collateral”. That has sparked the resumption of large demand here and away again for Credit downside hedges again seen in recent days…
As said “mechanical” Equities flows begin to dissipate following their 3 week impulse buy / short-cover, we are seeing a resumption is pretty substantial downside hedging from clients which in recent days has added significant “Negative $Delta” alongside resumption of large dynamic hedge “shorting” in futures in recent days (2nd largest “sell pressure” in our SPX futures trade imbalance monitor over the past 1m period seen yday).
McElligott concludes with a critical point that the aforementioned (and largely mechanical) flows are masking a lot of broken-ness out there.
Not to mention, still remarkably “stable Stocks” then allows the Fed to continue to “lean into” financial conditions and hawkish rhetoric – a concept which is at the fundamental core of my “Fed selling Calls” observation for months, which is limiting the market’s ability to break out of this same 4200 / 4650 range-trade.
Furthermore, the Nomura strategist points out that many of these observations are also why the fundamental / discretionary macro client side continues to fight any “chasing” of the rally, and instead, were power-selling / dynamically hedging in S&P futures all day, while again bidding Skew / Gamma / downside structures on Tuesday.
This grab for downside hedges – albeit a nascent move – has thus seen US Equities Index trading back into “Short Gamma vs Spot” territory again for Options Dealers in SPX / SPY, QQQ and IWM together for the first time in weeks – meaning that this down move is seeing corresponding “accelerant flow” from their hedges, selling into weakness now.
Specifically, as SpotGamma details, there is a dearth of downside protection, and a low level of implied volatility. If traders suddenly sought put protection, they would be doing so into a low/negative gamma market (4500-4600 “void”), and as they buy puts it foists negative deltas onto dealers books. To hedge, dealers may start shorting futures, which drives the market lower.
This starts a reflexive feedback loop of put buying ->dealer shorting->lower markets & more fear->more put buying.
Based on SPY, traders have drawn a clear line of bull/bear demarcation. Below you can see the sizeable interest of both puts and calls at 450, with predominately positive gamma/call positions above and put positions below.
In the gamma model below you can see that there is a steep slope lower to the gamma curve, which suggests accelerating velocity to the downside.
4400 is the first large initial support, and under there we have the new 4340 JPM put strike.
Again, below 4500 we are likely to have a volatile, negative gamma regime akin to what we saw in Feb/early March.
To the upside we’d view a recovery back above 4500 as critical for the bull case. Positive gamma market support however isn’t initiated until there is a move back to 4600.
Tyler Durden
Wed, 04/06/2022 – 09:55

