Morgan Stanley: Embrace The Late-Cycle Playbook
By Andrew Sheets, Morgan Stanley Chief Cross-Asset Strategist
Most of my meetings this week focused on yield curve inversion, a sign that the topic is either top-of-mind or is so widely discussed that everyone is tired of talking about it. Or maybe both. (As one investor put it this week, “We’re very focused on curve inversion and very tired of talking about it.)
What follows will discuss the yield curve, but I promise it won’t be the sole focus.
Indeed, what I’d really like to cover today is the cacophony of story lines that are all crashing together at the same time:
Growth is good, but it’s slowing.
Policy is easy, but it’s tightening.
Inflation is high, but it’s set to moderate.
Commodities are surging (or not, depending on the day).
Markets are often overdramatic about current conditions, but these developments really are striking. US nominal GDP grew by 14% (annualized) in 4Q21. US government bond yields just had their worst quarter since 1980. US inflation is the highest since 1982 and French inflation is the highest since 1985. Realized volatility in the oil market is at the 98th percentile.
So if you’re feeling a little worn out by the first quarter, a little lost and wondering how three months could feel like a year, well…there are pretty good reasons.
Yet dig a little deeper, and some of the uniqueness of the present moment fades away. A period where growth is good (but slowing), inflation is elevated and policy is tightening isn’t some ‘macro unicorn’ but rather a common pattern that tends to appear late in an economic expansion. Good growth pushes the economy above potential and unemployment toward cycle lows. This pushes up inflation, which pushes up policy rates, which flattens (and then inverts) the yield curve. Weaker parts of the market suffer, and breadth narrows as the tide of liquidity starts to roll out.
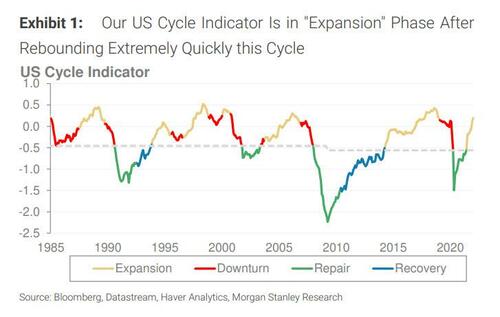
Investors saw that pattern in 1998 and 2000. They saw it in 2005-06 and again in 2019.
Each of these periods was a different flavor of ‘late cycle’. Quantitatively, each maps as being well into the ‘expansion’ phase of our Cross-Asset Cycle Indicator.
If one sees similarities between these periods and today (we do), implications emerge from the otherwise chaotic backdrop.
One is that curve inversion is not (in itself) a sell signal for equities, but does support moving up in quality, within both equity sectors and credit.
Global stocks have gained about 8% in the 12 months following the last four inversions of the US 2s10s curve.
Yet in those same periods, US high yield underperformed investment grade credit by about 5%, and US Utilities and Healthcare outperformed the S&P 500 by 6-8%, signs of late-cycle defensiveness working.
This ‘up in quality’ theme extends regionally. Following curve inversion, DM ex US equities (especially the FTSE 100) outperform EM stocks, and EM credit outperforms EM stocks. Our expected returns support these preferences today, especially after an additional downgrade of our price target for MSCI Emerging Market equities.
Finally, late-cycle periods can be good for commodities, especially oil. The ‘up in quality’ theme may be a function of investors demanding a higher discount rate for cyclicality as the cycle matures. But physical commodities can struggle to achieve similar foresight. Spot prices are set by the economy today, not where it may be 12-18 months from now. Brent rallied into November 2000 and July 2008, well past the start of equity market trouble. More broadly, oil, copper and gold have all averaged positive total returns in the 12 months following inversion of the US 2s10s curve.
These are unusual times. But we don’t think they are entirely without precedent. Whatever the ultimate path of growth over the next two years, embracing a late-cycle playbook makes sense today.
Tyler Durden
Sun, 04/03/2022 – 16:00


Recent Comments